Results
all results are pulled from what was reported at the Lethbridge site, more results can be found in the final report
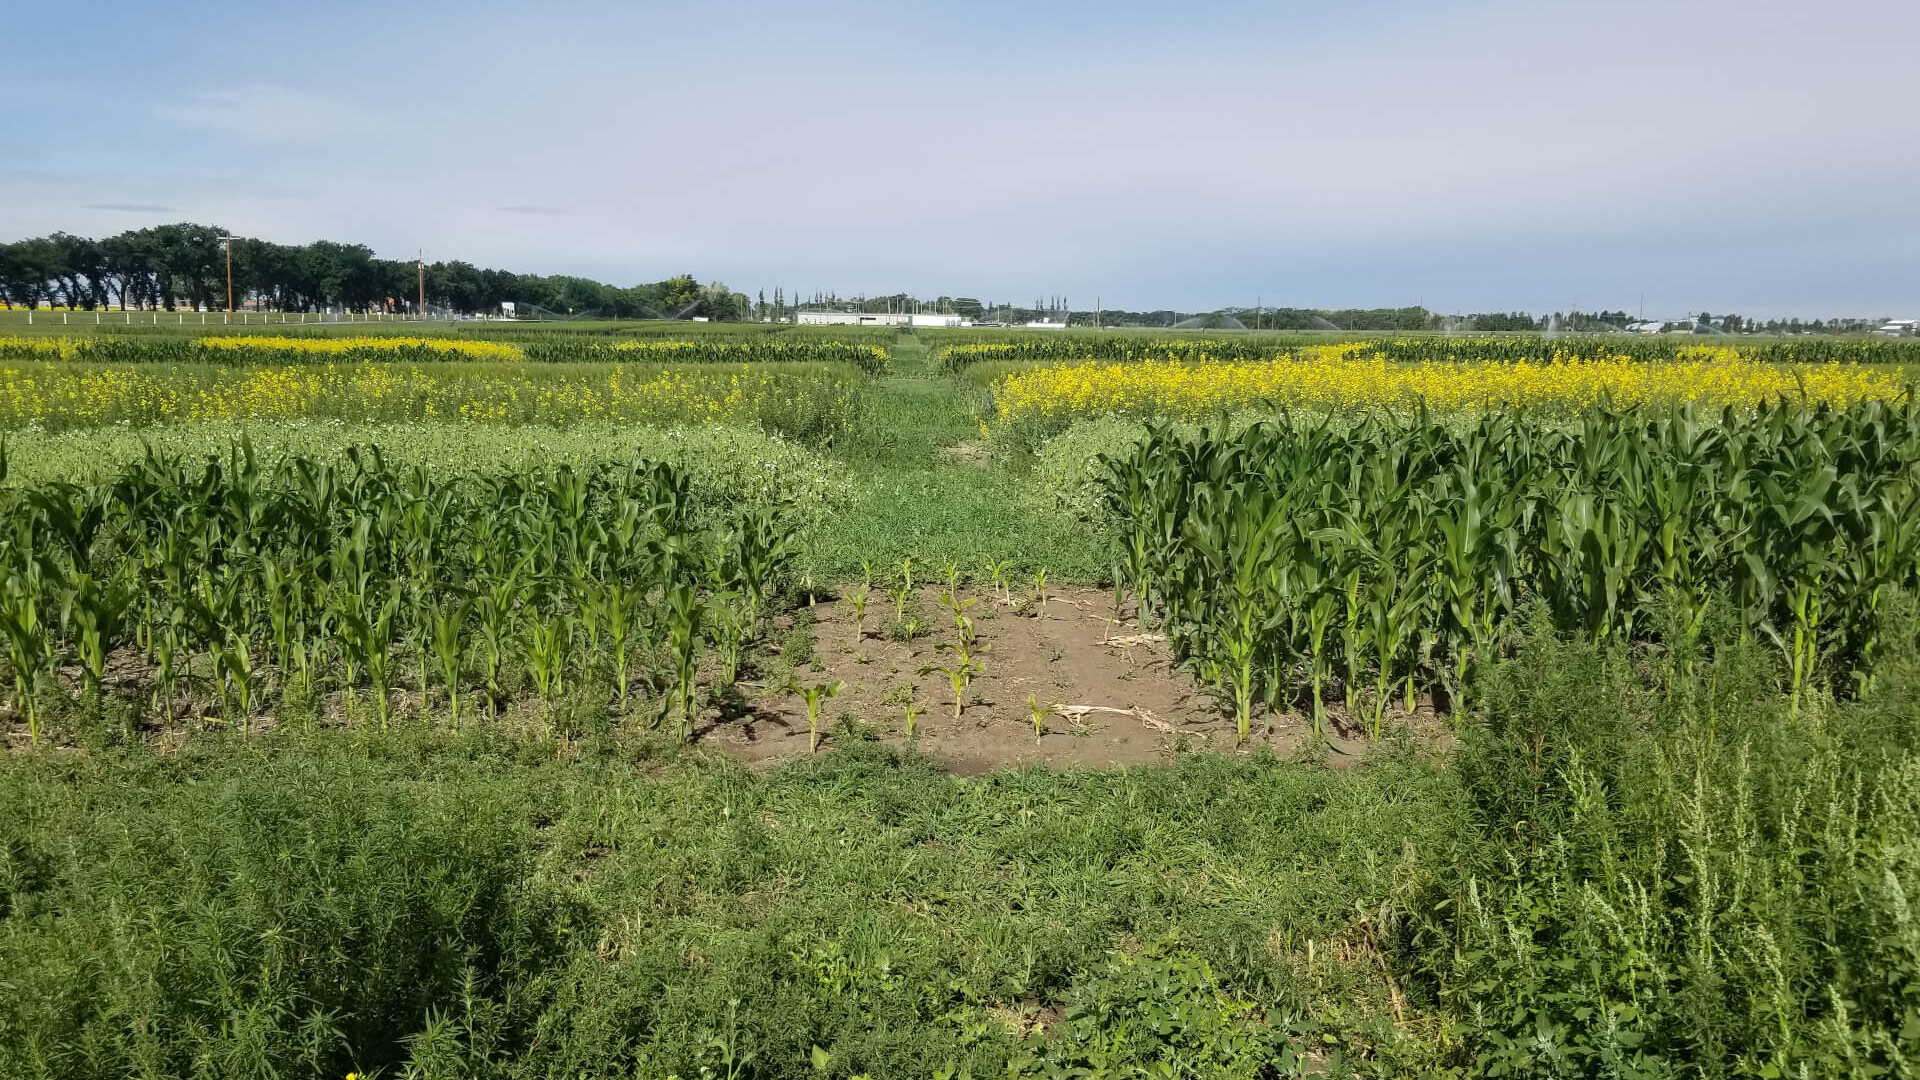
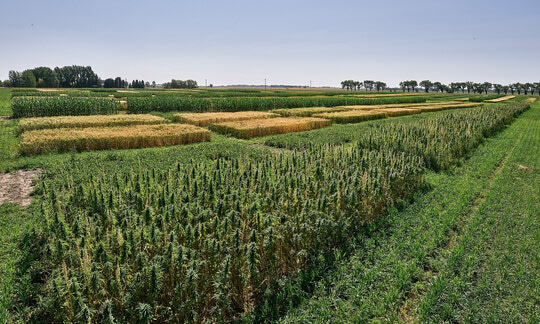
At the Lethbridge site, dry bean appears to be the superior preceding crop among all tested crops, although its performance was not significantly affected by any of the previously seeded crops. The highest biomass and seed yields were reported for the majority of crops grown on the dry bean stubble. However, these positive impacts of dry bean were only statically significant for the grain yield of wheat, durum and canola, while for the remaining crops the yield and biomass increasing properties of dry bean stubble, although conspicuous, appeared to be not as significant at P<0.05.
Conversely, the poorest performance in biomass yield was predominantly observed when a given crop was planted on canola stubble. On the other hand, the effect of stubble on grain yield reduction was crop/sequence specific. The lowest, statistically significant suppression was observed when canola, durum and wheat were seeded into their own stubbles.
Shortages of precipitation at the Lethbridge site were supplemented with irrigation, which resulted in the most uniform soil moisture conditions among the four participating locations. Despite this, highly significant statistical differences in seed and biomass yields were reported - which may explain the fairly low overall number of statistically significant differences observed among the effects of different stubbles on yield of grain and wet biomass.
Furthermore, very low weed pressure was reported at the Lethbridge site with many plots virtually free of volunteer crops. There was an exception to this, with volunteer canola being abundant in the plots seeded to hemp, quinoa, and canola. No significant differences in weed pressure and biomass of volunteer crops were recorded among the growing seasons.
|
Barley
No statistically significant effect of the preceding crop on barley grain yield was found. Reportedly, there was only a 10% difference between the highest yield on the dry bean stubble and the lowest yields on the wheat and barley stubbles (Table 6). Dry bean appeared to be the best stubble to promote growth of barley biomass, whereas seeding barley on wheat stubble caused a noticeable, yet not statistically significant, 30% reduction of aboveground parts of the plant.
No impact of the preceding crop on barley seedling establishment measured as stand density was reported (Table 6).
|
Table 6 - Performance of barley grown on eight stubbles expressed as stand density, crop biomass and seed yield at the Lethbridge site. The values represent averages of three growing seasons.
|
| Crop |
Stubble |
Density
(plants/m2)
|
Wet crop biomass
(kg/ha)
|
Yield
(kg/ha) |
|
Barley
|
Barley |
139.7a |
25059.1a |
6937.6a |
| Barley |
Canola |
157.1a |
28495.0a |
7073.1a |
| Barley |
Corn |
142.1a |
27814.6a |
7440.8a |
| Barley |
Bean |
143.8a |
33980.9a |
7679.4a |
| Barley |
Durum |
144.7a |
25333.5a |
7141.2a |
| Barley |
Hemp |
124.8a |
26779.7a |
7161.9a |
| Barley |
Pea |
140.2a |
31154.9a |
7203.9a |
| Barley |
Quinoa |
163.2a |
28871.3a |
7782.1a |
| Barley |
Wheat |
148.5a |
23859.9a |
6923.1a |
|
Canola
Dry bean appeared to be the best preceding crop for canola biomass yields, and the highest, statistically significant, seed yield of canola was from the plots established on the bean, pea, and quinoa stubbles. On the other hand, both vegetative growth and seed yield were each roughly 30% lesser when canola was seeded into its own stubble. However, in terms of vegetative growth, the negative impacts of monoculture management was not statistically significant (Table 11).
No impact of the preceding crop on canola seedling establishment measured as stand density was reported (Table 11).
|
Table 11 - Performance of canola grown on eight stubbles expressed as stand density, crop biomass and seed yield at the Lethbridge site. The values represent averages of three growing seasons.
|
| Crop |
Stubble |
Density
(plants/m2)
|
Wet crop biomass
(kg/ha)
|
Yield
(kg/ha) |
|
Canola
|
Barley |
32.9a |
33899.1a |
2618.1ab |
| Canola |
Canola |
77.9b |
24415.1a |
2009.7a |
| Canola |
Corn |
34.0a |
29728.3a |
2603.7ab |
| Canola |
Bean |
36.1a |
38405.6a |
2824.8b |
| Canola |
Durum |
38.3a |
31528.4a |
2610.2ab |
| Canola |
Hemp |
32.6a |
30888.8a |
2135.6ab |
| Canola |
Pea |
45.6a |
36781.9a |
2752.8b |
| Canola |
Quinoa |
35.6a |
32510.8a |
2791.3b |
| Canola |
Wheat |
34.2a |
32508.6a |
2234.2ab |
|
Corn
The highest grain yields of corn were obtained in plots previously seeded to quinoa, pea and dry bean, while the lowest grain yields were reported when corn was planted on wheat stubble (Table 16). However, the difference of 24% between the highest and lowest grain yield was not statistically significant. Meanwhile, dry bean and pea stubbles appeared to be the best for corn biomass, whereas seeding corn into canola and its own stubble resulted in the lowest, yet not statistically significant, corn biomass (Table 16).
No impact of the preceding crop on corn seedling establishment measured as stand density was reported (Table 16).
|
Table 16 - Performance of corn grown on eight stubbles expressed as stand density, crop biomass and seed yield at the Lethbridge site. The values represent averages of three growing seasons.
|
| Crop |
Stubble |
Density
(plants/m2)
|
Wet crop biomass
(kg/ha)
|
Yield
(kg/ha) |
|
Corn
|
Barley |
21.2a |
37772.7a |
8129.8a |
| Corn |
Canola |
18.4a |
31498.7a |
7790.8a |
| Corn |
Corn |
20.2a |
31253.3a |
7980.4a |
| Corn |
Bean |
21.8a |
47257.5a |
8497.4a |
| Corn |
Durum |
21.9a |
34351.0a |
7963.4a |
| Corn |
Hemp |
19.9a |
33643.9a |
7967.6a |
| Corn |
Pea |
21.7a |
44041.9a |
8404.2a |
| Corn |
Quinoa |
21.2a |
38827.6a |
9035.8a |
| Corn |
Wheat |
21.3a |
34464.2a |
6892.1a |
|
Dry bean
At the Lethbridge site, dry bean appeared to be the best preceding crop to increase grain and biomass yields of the vast majority of other crops, including dry bean itself. The highest seed yield was achieved when dry bean was seeded on its own stubble and in sequence with wheat (Table 21). Dry bean seed yields were one-third lower when planted on the canola and quinoa stubbles.
A similar pattern of response to the preceding crop was observed with respect to biomass yield of dry bean. Again, the highest vegetative production was computed when dry bean was planted on its own stubble, while the lowest yields were harvested from the plots previously seeded to quinoa and corn.
The differences in both seed and biomass yields of dry bean planted on different stubbles, although substantial, were not statistically significant (Table 21). No significant effects of the preceding crop on dry bean seedling establishment measured as stand density was reported, although the highest number of plants was recorded on plots previously seeded to dry bean itself (Table 21).
The above results may imply that, in contrast to several other studied crops, short term monoculture did not adversely impact growth of dry bean, perhaps as long as the crop does not experience notable disease pressure.
|
Table 21 - Performance of dry bean grown on eight stubbles expressed as stand density, crop biomass and seed yield at the Lethbridge site. The values represent averages of three growing seasons.
|
| Crop |
Stubble |
Density
(plants/m2)
|
Wet crop biomass
(kg/ha)
|
Yield
(kg/ha) |
|
Bean
|
Barley |
14.8a |
11867.5a |
1098.5a |
| Bean |
Canola |
15.0a |
11650.9a |
892.6a |
| Bean |
Corn |
12.8a |
10980.9a |
923.3a |
| Bean |
Bean |
17.0a |
16419.9a |
1283.1a |
| Bean |
Durum |
13.0a |
12797.4a |
978.9a |
| Bean |
Hemp |
13.6a |
12469.7a |
869.8a |
| Bean |
Pea |
16.0a |
13958.4a |
1015.4a |
| Bean |
Quinoa |
15.8a |
10650.0a |
845.0a |
| Bean |
Wheat |
13.8a |
12070.4a |
1229.6a |
|
Durum wheat
The highest, statistically significant grain yield of durum wheat resulted from dry bean stubble, while 25% lower yield was recorded when durum was seeded on its own stubble (Table 26). Meanwhile, seeding on dry bean stubble resulted in the highest biomass yield of durum wheat, while 20% lower biomass yield was found from the plots previously seeded to hemp, however the reported differences were not statistically significant (Table 26).
Surprisingly, hemp and corn stubbles suppressed establishment of durum wheat since plant density on such plots was the lowest among all treatments, and the difference between the highest stand density that was computed on the durum wheat stubble was statistically significant but only for hemp (Table 26).
|
Table 26 - Performance of durum wheat grown on eight stubbles expressed as stand density, crop biomass and seed yield at the Lethbridge site. The values represent averages of three growing seasons.
|
| Crop |
Stubble |
Density
(plants/m2)
|
Wet crop biomass
(kg/ha)
|
Yield
(kg/ha) |
|
Durum
|
Barley |
138.1ab |
22104.2a |
5927.9abc |
| Durum |
Canola |
144.2ab |
19702.1a |
5899.2abc |
| Durum |
Corn |
119.6ab |
19538.9a |
6063.8abc |
| Durum |
Bean |
140.9ab |
24171.9a |
6811.7c |
| Durum |
Durum |
150.4a |
22044.3a |
5106.8a |
| Durum |
Hemp |
114.7b |
19202.7a |
5327.8ab |
| Durum |
Pea |
141.9ab |
23885.9a |
6554.8bc |
| Durum |
Quinoa |
141.6ab |
21028.5a |
6031.4abc |
| Durum |
Wheat |
147.3ab |
20502.7a |
5371.6ab |
|
Hemp
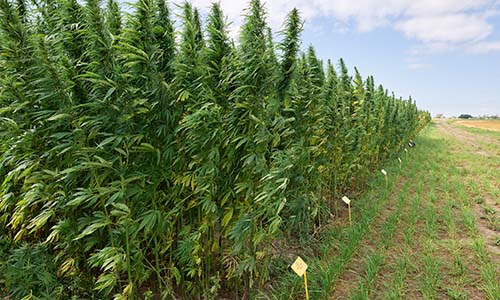
The best preceding crop for hemp grain production appeared to be durum wheat stubble, while seeding hemp on wheat, barley, and corn stubbles reduced grain yield by approximately one-third (Table 31). This observed was unexpected since the majority of hemp grain producers tend to grow the crop in sequence with wheat or barley. However, the responses to the cereals were not statistically significant.
A diametric response of hemp straw yields to the preceding crop was observed. The highest fibre yields were recorded when hemp was seeded on dry bean and pea stubbles, while fibre yields harvested from the plots established on the canola and corn stubble were one-third lower. Again, the reported differences were not statistically significant (Table 31).
It is worth noting that corn as a preceding crop negatively impacted both hemp grain and straw yields, presumably due to reducing hemp's ability to establish a dense canopy. Considerable, yet not statistically significant, differences were found in stand density between hemp planted on the corn and other stubbles (Table 31).
|
Table 31 - Performance of hemp grown on eight stubbles expressed as stand density, crop biomass and seed yield at the Lethbridge site. The values represent averages of three growing seasons.
|
| Crop |
Stubble |
Density
(plants/m2)
|
Wet crop biomass
(kg/ha)
|
Yield
(kg/ha) |
|
Hemp
|
Barley |
105.5a |
15914.4a |
865.2a |
| Hemp |
Canola |
118.2a |
12688.0a |
1169.1a |
| Hemp |
Corn |
80.9a |
12443.4a |
972.1a |
| Hemp |
Bean |
114.6a |
18930.6a |
1163.1a |
| Hemp |
Durum |
113.7a |
14964.2a |
1341.0a |
| Hemp |
Hemp |
104.6a |
14420.6a |
1149.5a |
| Hemp |
Pea |
123.2a |
18157.1a |
1016.9a |
| Hemp |
Quinoa |
126.8a |
16963.3a |
1122.6a |
| Hemp |
Wheat |
110.7a |
14815.1a |
938.7a |
|
Pea
Although no preceding crops impacted the performance of pea with statistical significance, as with many other crops, dry bean was the best stubble to promote seed yield while yields on hemp stubble were 22% lower (Table 36). Additionally, while not statistically significant, dry bean also appeared to be the best preceding crop for wet biomass production of pea, whereas 27% lower biomass yields were obtained when pea was seeded into its own stubble (Table 36).
As in several other crops tested at the Lethbridge site, no effect of the preceding crop on pea seedling establishment measured as stand density was reported (Table 36).
|
Table 36 - Performance of pea on eight stubbles expressed as stand density, crop biomass and seed yield at the Lethbridge site. The values represent averages of three growing seasons.
|
| Crop |
Stubble |
Density
(plants/m2)
|
Wet crop biomass
(kg/ha)
|
Yield
(kg/ha) |
|
Pea
|
Barley |
64.7a |
27261.5a |
4281.9a |
| Pea |
Canola |
60.4a |
25233.9a |
4487.9a |
| Pea |
Corn |
58.0a |
27027.0a |
4554.5a |
| Pea |
Bean |
68.5a |
33462.0a |
5081.5a |
| Pea |
Durum |
64.6a |
26436.2a |
4358.3a |
| Pea |
Hemp |
57.6a |
27794.1a |
3944.2a |
| Pea |
Pea |
66.8a |
24463.2a |
4116.8a |
| Pea |
Quinoa |
62.7a |
30375.2a |
4632.0a |
| Pea |
Wheat |
64.9a |
26820.1a |
4093.4a |
|
Quinoa
Small grain cereal stubbles and legumes appeared to be the most suitable for quinoa production. Both barley and wheat as the preceding crops resulted in the highest seed yield of quinoa, while the lowest grain yield was computed when quinoa was seeded on its own stubble (Table 41). Quinoa yielded nearly 50% less grain than on the cereal and legume crops under such management scenarios.
A similar response pattern to the preceding crop was reported for quinoa biomass production. Again, the highest biomass was harvested from the plots previously grown to barley and wheat, while quinoa biomass was 50% lower when grown as a monoculture (Table 41).
|
Table 41 - Performance of quinoa grown on eight stubbles expressed as stand density, crop biomass and seed yield at the Lethbridge site. The values represent averages of three growing seasons.
|
| Crop |
Stubble |
Density
(plants/m2)
|
Wet crop biomass
(kg/ha)
|
Yield
(kg/ha) |
|
Quinoa
|
Barley |
56.3a |
29682.0a |
1113.6a |
| Quinoa |
Canola |
41.4a |
16069.9a |
873.6a |
| Quinoa |
Corn |
48.3a |
19271.3a |
871.6a |
| Quinoa |
Bean |
66.8a |
20545.1a |
1015.8a |
| Quinoa |
Durum |
51.1a |
21553.7a |
923.9a |
| Quinoa |
Hemp |
41.9a |
18879.9a |
805.7a |
| Quinoa |
Pea |
65.6a |
24405.1a |
1064.0a |
| Quinoa |
Quinoa |
97.2a |
15709.6a |
606.4a |
| Quinoa |
Wheat |
64.9a |
28030.2a |
1104.8a |
|
Wheat
Similar to other crops tested at the Lethbridge site, dry bean stubble created an environment conducive to achieving the highest grain yields by wheat. Meanwhile, a statistically significant 20% reduction of grain yields were obtained when wheat was seeded on barley and its own stubble (Table 45). The highest wheat biomass yields were harvested from the plots established on dry bean stubble, whereas growing wheat on its own stubble resulted in 22% lower biomass (Table 45).
|
Table 45 - Performance of wheat grown on eight stubbles expressed as stand density, crop biomass and seed yield at the Lethbridge site. The values represent averages of three growing seasons.
|
| Crop |
Stubble |
Density
(plants/m2)
|
Wet crop biomass
(kg/ha)
|
Yield
(kg/ha) |
|
Wheat
|
Barley |
153.5ab |
26354.0a |
4957.1b |
| Wheat |
Canola |
174.6ab |
24919.5a |
5966.8ab |
| Wheat |
Corn |
154.2ab |
22711.5a |
6252.9ab |
| Wheat |
Bean |
168.8ab |
28064.9a |
6443.7a |
| Wheat |
Durum |
174.6ab |
22959.7a |
5872.4ab |
| Wheat |
Hemp |
127.9b |
23309.5a |
5751.5ab |
| Wheat |
Pea |
171.8ab |
26580.9a |
6088.9ab |
| Wheat |
Quinoa |
189.3a |
23710.1a |
6217.1ab |
| Wheat |
Wheat |
183.5ab |
21602.1a |
5044.3b |
|
|


